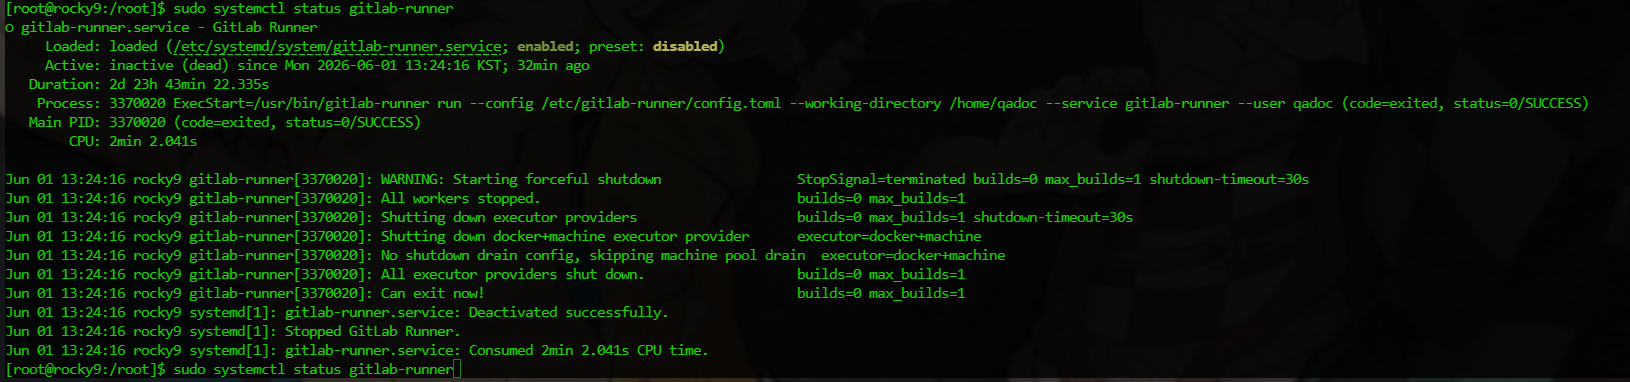
1. 러너 상태 확인 (Status) 러너가 현재 잘 켜져 있는지, 꺼져 있는지 가장 먼저 점검할 때 사용합니다.
sudo systemctl status gitlab-runner
확인 팁: 결과 화면에 초록색으로 active (running)이 뜨면 정상, inactive (dead)나 failed가 뜨면 꺼져있는 상태입니다. (화면에서 빠져나오려면 q를 누르세요.)
2. 러너 시작 (Start) 꺼져 있는 러너 서비스를 켭니다.
sudo systemctl start gitlab-runner
3. 러너 중지 (Stop) 서버 점검이나 러너 동작을 아예 멈추고 싶을 때 사용합니다. (진행 중이던 배포 작업이 있다면 실패 처리될 수 있으므로 작업이 없을 때 수행하세요.)
sudo systemctl stop gitlab-runner
4. 러너 재시작 (Restart) ⭐️ 러너를 껐다가 바로 다시 켭니다. 에러가 났을 때 가장 먼저 시도해 볼 만한 응급처치이며, 특히 관리자가 러너 설정 파일(/etc/gitlab-runner/config.toml)을 직접 수정했을 때 변경 사항을 적용하기 위해 반드시 쳐야 하는 명령어입
sudo systemctl restart gitlab-runner
5. 서버 부팅 시 자동 시작 켜기 (Enable) 리눅스 서버가 재부팅되었을 때, 관리자가 일일이 켜주지 않아도 GitLab Runner가 알아서 백그라운드에서 실행되도록 예약합니다. (설치 시 기본적으로 켜져 있습니다.)
sudo systemctl enable gitlab-runner
6. 서버 부팅 시 자동 시작 끄기 (Disable) 서버가 켜질 때 러너가 자동으로 켜지는 것을 막습니다.
설치하려는 디렉토리로 이동해서 Nginx 를 다운로드 받아 아래 절차에 따라 설치를 진행 합니다.
# 1. 홈 디렉토리로 이동
cd /home/qadoc/

# 2. Nginx 소스 다운로드 (최신 안정화 버전 1.24.0 기준, 필요시 버전 변경)
wget http://nginx.org/download/nginx-1.24.0.tar.gz

# 3. 압축 해제 및 폴더 이동
tar -zxvf nginx-1.24.0.tar.gz
cd nginx-1.24.0/

# 4. 설치 환경 설정 (configure)
# --prefix 옵션이 핵심입니다. 이 경로에 Nginx가 설치됩니다.
# 홈 디렉토리 아래의 nginx 이라는 폴더에 설치하도록 지정합니다.
./configure --prefix=$HOME/nginx --with-http_ssl_module

# 5. 컴파일 및 설치
make
make install
설치가 완료 되면 다운로드 받은 파일은 삭제 해도 됩니다.
2. Nginx 설정 변경 (포트 및 경로 설정)
일반 사용자는 1~1023번(Well-known ports, 예: 80, 443) 포트를 사용할 수 없습니다.
따라서 1024번 이상의 포트(예: 8080, 8888 등)로 설정해야 합니다.
로컬에 설치된 Nginx의 설정 파일을 엽니다.
vi ~/nginx/conf/nginx.conf
nginx.conf
# worker 프로세스 설정 (로컬 계정이므로 user 지시어는 사용하지 않음)
worker_processes  1;

# 에러 로그 경로 (로컬 폴더 내에 저장됨)
error_log  logs/error.log;
pid        logs/nginx.pid;

events {
    worker_connections  1024;
}

http {
    include       mime.types;
    default_type  application/octet-stream;

    # 접근 로그 경로
    access_log  logs/access.log;

    sendfile        on;
    keepalive_timeout  65;

    server {
        # 일반 사용자가 열 수 있는 포트 (예: 8081)
        listen       8081;
        server_name  localhost;

        # MkDocs 빌드 파일이 위치할 절대 경로 지정
        # (예: /home/myuser/mkdocs_site)
        location / {
            root   /home/qadoc/mkdocs_site;
            index  index.html index.htm;
        }

        error_page   500 502 503 504  /50x.html;
        location = /50x.html {
            root   html;
        }
    }
}
파일 설정이 완료 되었다면 설정상 문제 가 없는지 아래 명령으로 확인 합니다.
$ ~/nginx/sbin/nginx -t
nginx: the configuration file /home/qadoc/nginx/conf/nginx.conf syntax is ok
nginx: configuration file /home/qadoc/nginx/conf/nginx.conf test is successful
명령
# 설정 파일 문법 테스트
~/nginx/sbin/nginx -t

# Nginx 백그라운드 실행
~/nginx/sbin/nginx

# Nginx 프로세스 확인(정상 기동)
ps -ef | grep nginx
Nginx 기동/중지 스크립트 작성
조작을 쉽게 하기위해 스크립트를 만듭니다.
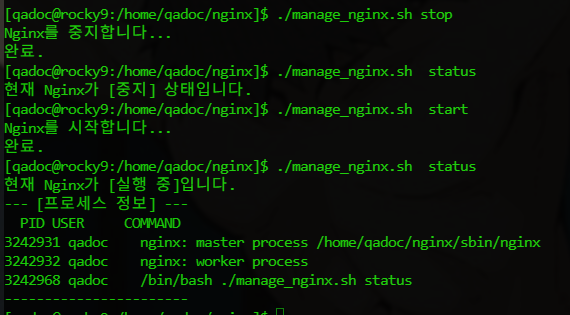
사용 방법
시작: ./manage_nginx.sh start
중지: ./manage_nginx.sh stop
설정 재적용: ./manage_nginx.sh reload
재시작: ./manage_nginx.sh restart
상태 확인: ./manage_nginx.sh status
이제부터는 복잡한 경로를 입력할 필요 없이, 아래처럼 스크립트 하나로 Nginx를 쉽게 제어할 수 있습니다.
#!/bin/bash

# Nginx 실행 파일 경로를 변수로 지정합니다.
# 경로가 다르다면 이 부분을 수정해 주세요.
NGINX_BIN="$HOME/nginx/sbin/nginx"

# 실행 인자($1)가 없는 경우 안내 메시지를 출력합니다.
if [ -z "$1" ]; then
    echo "사용법: $0 {start|stop|reload|restart|status}"
    exit 1
fi

case "$1" in
    start)
        echo "Nginx를 시작합니다..."
        $NGINX_BIN
        echo "완료."
        ;;
    stop)
        echo "Nginx를 중지합니다..."
        $NGINX_BIN -s stop
        echo "완료."
        ;;
    reload)
        echo "Nginx 설정을 무중단으로 재적용합니다..."
        $NGINX_BIN -s reload
        echo "완료."
        ;;
    restart)
        echo "Nginx를 재시작합니다..."
        $NGINX_BIN -s stop
        sleep 2  # 프로세스가 완전히 죽을 때까지 2초 대기
        $NGINX_BIN
        echo "완료."
        ;;
     status)
        # 1. 현재 쉘을 실행 중인 사용자 이름 가져오기
        CURRENT_USER=$(whoami)

        # 2. 본인 계정($CURRENT_USER)으로 실행된 nginx 마스터 프로세스 찾기
        #    (grep "[n]ginx" 기법을 사용하여 grep 명령어 자체는 결과에서 제외)
        NGINX_PS=$(ps -u "$CURRENT_USER" -o pid,user,args | grep "[n]ginx: master process")

        # 3. 결과 문자열의 길이가 0이 아니면(-n) 실행 중인 것으로 판단
        if [ -n "$NGINX_PS" ]; then
            echo "현재 Nginx가 [실행 중]입니다."
            echo "--- [프로세스 정보] ---"
            echo "  PID USER     COMMAND"

            # 본인 계정의 전체 nginx 프로세스(master + worker 등)를 깔끔하게 출력
            ps -u "$CURRENT_USER" -o pid,user,args | grep "[n]ginx"
            echo "-----------------------"
        else
            echo "현재 Nginx가 [중지] 상태입니다."
        fi
        ;;
    *)
        echo "지원하지 않는 명령어입니다: $1"
        echo "사용법: $0 {start|stop|reload|restart|status}"
        exit 1
        ;;
esac
구축이 완료되었으니 DBeaver, SQL Developer 또는 터미널을 통해 접속해 봅니다.
접속 정보 요약 (중요)
Oracle 23ai Free 버전은 기존 XE와 달리 서비스명(Service Name)이 다릅니다.
Host: localhost (또는 서버의 IP)
Port: 1523
Service Name (PDB): FREEPDB1 (기존 XE처럼 XE를 입력하면 접속 안 됩니다!)
User: SYS (권한: SYSDBA) 또는 SYSTEM
Password: docker-compose.yml에서 설정한 ORACLE_PWD 값
💻 터미널에서 직접 접속해 보기 (SQL*Plus)
컨테이너 내부에 내장된 SQL*Plus를 이용해 바로 쿼리를 날려볼 수도 있습니다.
# SYS 계정으로 접속
podman exec -it oracle-23ai sqlplus sys/Oracle23ai@FREEPDB1 as sysdba

# or 컨테이너에 접속후 sqlplus 수행
#podman exec -it oracle-23ai bash
#sqlplus sys/Oracle23ai@FREEPDB1 as sysdba

# 버전 확인 쿼리 실행
SQL> SELECT banner FROM v$version;
정상적으로 Oracle Database 23ai Free 관련 정보가 출력된다면 성공입니다!
🧹 (참고) 컨테이너 중지 및 삭제
사용을 마치고 컨테이너를 내리고 싶을 때는 아래 명령어를 사용합니다.
# 중지 및 컨테이너 삭제 (oradata 폴더의 데이터는 그대로 유지됨)
podman compose down
목적: 다운로드한 거대한 LLM 모델 파일들을 컨테이너가 삭제되어도 호스트에 영구적으로 보관하기 위함입니다.
기타:
# devices: - nvidia.com/gpu=all: 주석 처리되어 있지만, NVIDIA GPU를 사용하여 성능을 가속화하려면 이 부분의 주석을 해제하고 관련 설정(NVIDIA Container Toolkit 등)을 해야 합니다.
security_opt: - label=disable: SELinux 등의 보안 레이블링을 비활성화하여 권한 문제를 방지합니다.
restart: always: 컨테이너가 죽으면 자동으로 재시작합니다.
open-webui 서비스 (프론트엔드 웹 인터페이스)
역할: 사용자가 웹 브라우저를 통해 Ollama와 쉽게 상호작용(채팅, 모델 관리 등)할 수 있도록 돕는 웹 애플리케이션입니다. ChatGPT와 유사한 UI를 서비스를 제공 합니다.
이미지: ghcr.io/open-webui/open-webui:main (Open WebUI 공식 메인 브랜치 이미지 사용)
포트:
컨테이너 내부의 웹 서버 포트 8080을 호스트의 3000 포트와 연결합니다.
사용자는 브라우저에서 http://localhost:3000으로 접속하게 됩니다.
환경 변수:
OLLAMA_BASE_URL=http://ollama:11434: 가장 중요한 연결 고리입니다. Open WebUI가 API 요청을 보낼 Ollama 서버의 주소를 지정합니다. 여기서 http://ollama는 도커 네트워크 내부에서 ollama 컨테이너를 가리키는 호스트 이름(서비스 이름)입니다.
최근 리눅스 환경(특히 RHEL, Rocky, 최신 Ubuntu 등)에서 Docker 대신 Podman을 사용하여 컨테이너를 관리하는 경우가 많아졌습니다. Podman은 데몬 없이 작동하고 Rootless(관리자 권한 없이 실행) 모드를 지원하여 보안상 이점이 크지만, Docker와 미세하게 다른 설정 때문에 당황스러운 에러를 겪기도 합니다.
오늘은 docker-compose.yml을 이용해 MariaDB를 설치하는 과정에 대해 공유 합니다.
1. docker-compose.yml 작성
먼저 MariaDB 11.3 버전을 설치하기 위해 구성 파일을 작성합니다. Podman 환경이라도 파일명은 docker-compose.yml을 그대로 사용하면 podman-compose 명령어가 자동으로 인식합니다.
#설치 및 기동
podman compose up
#background 실행
podman compose up -d
#Mariadb 기동 상태 확인
podman compose ps
#종료
podman compose down
[mig-db@rocky9:~/mariadb]$ podman compose up >>>> Executing external compose provider "/usr/local/bin/podman-compose". Please see podman-compose(1) for how to disable this message. <<<<
0432514b156c83332ceef9385ce6cfbe7c0192c9cbdb5e9f5dd22fe9cc1b252f ffe11f79561b93175d00b04ecb5f3d762143a75a1a723b88d92de704fbe1a0e2 [mariadb] | 2026-01-23 02:22:56+00:00 [Note] [Entrypoint]: Entrypoint script for MariaDB Server 1:11.3.2+maria~ubu2204 started. [mariadb] | 2026-01-23 02:22:56+00:00 [Warn] [Entrypoint]: /sys/fs/cgroup///memory.pressure not writable, functionality unavailable to MariaDB [mariadb] | 2026-01-23 02:22:56+00:00 [Note] [Entrypoint]: Switching to dedicated user 'mysql' [mariadb] | 2026-01-23 02:22:56+00:00 [Note] [Entrypoint]: Entrypoint script for MariaDB Server 1:11.3.2+maria~ubu2204 started. [mariadb] | 2026-01-23 02:22:56+00:00 [Note] [Entrypoint]: MariaDB upgrade not required [mariadb] | 2026-01-23 2:22:56 0 [Note] Starting MariaDB 11.3.2-MariaDB-1:11.3.2+maria~ubu2204 source revision 068a6819eb63bcb01fdfa037c9bf3bf63c33ee42 as process 1 [mariadb] | 2026-01-23 2:22:56 0 [Note] InnoDB: Compressed tables use zlib 1.2.11 [mariadb] | 2026-01-23 2:22:56 0 [Note] InnoDB: Number of transaction pools: 1 [mariadb] | 2026-01-23 2:22:56 0 [Note] InnoDB: Using crc32 + pclmulqdq instructions [mariadb] | 2026-01-23 2:22:56 0 [Note] mariadbd: O_TMPFILE is not supported on /tmp (disabling future attempts) [mariadb] | 2026-01-23 2:22:56 0 [Note] InnoDB: Initializing buffer pool, total size = 128.000MiB, chunk size = 2.000MiB [mariadb] | 2026-01-23 2:22:56 0 [Note] InnoDB: Completed initialization of buffer pool [mariadb] | 2026-01-23 2:22:56 0 [Note] InnoDB: File system buffers for log disabled (block size=4096 bytes) [mariadb] | 2026-01-23 2:22:56 0 [Note] InnoDB: End of log at LSN=47661 [mariadb] | 2026-01-23 2:22:57 0 [Note] InnoDB: Opened 3 undo tablespaces [mariadb] | 2026-01-23 2:22:57 0 [Note] InnoDB: 128 rollback segments in 3 undo tablespaces are active. [mariadb] | 2026-01-23 2:22:57 0 [Note] InnoDB: Setting file './ibtmp1' size to 12.000MiB. Physically writing the file full; Please wait ... [mariadb] | 2026-01-23 2:22:57 0 [Note] InnoDB: File './ibtmp1' size is now 12.000MiB. [mariadb] | 2026-01-23 2:22:57 0 [Note] InnoDB: log sequence number 47661; transaction id 14 [mariadb] | 2026-01-23 2:22:57 0 [Note] Plugin 'FEEDBACK' is disabled. [mariadb] | 2026-01-23 2:22:57 0 [Note] Plugin 'wsrep-provider' is disabled. [mariadb] | 2026-01-23 2:22:57 0 [Note] InnoDB: Loading buffer pool(s) from /var/lib/mysql/ib_buffer_pool [mariadb] | 2026-01-23 2:22:57 0 [Note] Server socket created on IP: '0.0.0.0'. [mariadb] | 2026-01-23 2:22:57 0 [Note] Server socket created on IP: '::'. [mariadb] | 2026-01-23 2:22:57 0 [Note] mariadbd: Event Scheduler: Loaded 0 events [mariadb] | 2026-01-23 2:22:57 0 [Note] InnoDB: Buffer pool(s) load completed at 260123 2:22:57 [mariadb] | 2026-01-23 2:22:57 0 [Note] mariadbd: ready for connections. [mariadb] | Version: '11.3.2-MariaDB-1:11.3.2+maria~ubu2204' socket: '/run/mysqld/mysqld.sock' port: 3306 mariadb.org binary distribution ^C[mig-db@rocky9:~/mariadb]$ [mariadb] | 2026-01-23 2:23:28 0 [Note] mariadbd (initiated by: unknown): Normal shutdown [mariadb] | 2026-01-23 2:23:28 0 [Note] InnoDB: FTS optimize thread exiting. [mariadb] | 2026-01-23 2:23:28 0 [Note] InnoDB: Starting shutdown... [mariadb] | 2026-01-23 2:23:28 0 [Note] InnoDB: Dumping buffer pool(s) to /var/lib/mysql/ib_buffer_pool [mariadb] | 2026-01-23 2:23:28 0 [Note] InnoDB: Buffer pool(s) dump completed at 260123 2:23:28 [mariadb] | 2026-01-23 2:23:28 0 [Note] InnoDB: Removed temporary tablespace data file: "./ibtmp1" [mariadb] | 2026-01-23 2:23:28 0 [Note] InnoDB: Shutdown completed; log sequence number 47661; transaction id 15 [mariadb] | 2026-01-23 2:23:28 0 [Note] mariadbd: Shutdown complete [mariadb] | mariadb 0432514b156c83332ceef9385ce6cfbe7c0192c9cbdb5e9f5dd22fe9cc1b252f mariadb_default
Mariadb 접속
podman exec -it mariadb mariadb -u root -p
# Password 입력 프롬프트가 뜨면 설정한 비밀번호(rootpassword) 입력
# docker-compose.yml 에 작성된 비밀번호를 입력한다.
실습
# 1.'mariadb'는 접속 :  docker-compose에서 정한 컨테이너 이름입니다.
podman exec -it mariadb mariadb -u root -p

# 2. docker-compose 설정 파일에서 만든 mydb 데이터베이스로 이동
USE mydb;

#3. 테이블 생성
CREATE TABLE users (
    id INT AUTO_INCREMENT PRIMARY KEY,
    username VARCHAR(50) NOT NULL,
    email VARCHAR(100)
);

#4. 데이터 입력 (한글 테스트)
INSERT INTO users (username, email) VALUES ('홍길동', 'hong@test.com');
INSERT INTO users (username, email) VALUES ('Alice', 'alice@test.com');

#5. 데이터 조회
SELECT * FROM users;
DBeaver 연결 설정 방법
문제발생 해결 방법
작성한 파일을 실행하기 위해 터미널에 podman-compose up -d를 입력했는데, 컨테이너가 뜨지 않고 아래와 같은 에러 로그가 출력이 됨.
[에러 메시지] Error: unable to start container ... : did not receive systemd slice as cgroup parent when using systemd to manage cgroups: invalid argument
원인 분석
이 에러는 Podman(Rootless 모드)이 시스템의 systemd와 상호작용할 때 Cgroup(리소스 관리) 설정이 충돌하여 발생하는 문제로 , 일반 사용자 권한으로 실행 중인데 시스템 관리 영역인 systemd cgroup에 접근하려다 거절당한 것입니다.
이때 sudo를 붙여서 실행하면 해결되긴 하지만, 그렇게 되면 생성되는 DB 파일들의 소유권이 root가 되어버립니다. 나중에 파일 이동이나 백업 시 Permission Denied로 고생할 수 있으므로 권장하지 않습니다.
해결 방법: containers.conf 설정 (권장)
가장 깔끔한 해결책은 Podman이 시스템의 systemd 대신 자체적인 cgroupfs를 사용하도록 설정을 변경하는 것입니다. 이 설정은 현재 로그인한 사용자 계정에만 적용된다.
mkdir -p ~/.config/containers
vi ~/.config/containers/containers.conf
# 기존 Podman 또는 Docker 패키지 제거
sudo dnf remove podman-docker podman

# Docker CE 레포 추가
sudo dnf config-manager --add-repo https://download.docker.com/linux/centos/docker-ce.repo

# Docker CE 설치
sudo dnf -y install docker-ce docker-ce-cli containerd.io

# Docker 서비스 활성화
sudo systemctl enable --now docker

# 버전 확인
docker --version
docker-compose version
참고: Podman 환경에서는 Harbor install.sh가 Docker 버전 체크로 실패할 수 있으므로, 운영 환경에서는 Docker CE 설치를 권장합니다.
wget https://github.com/goharbor/harbor/releases/download/v2.11.0/harbor-online-installer-v2.11.0.tgz
tar xvf harbor-online-installer-v2.11.0.tgz
cd harbor


 첫번 째 아래 에러는 일반 사용자(Rootless) 권한으로 Podman을 실행할 때, 사용자 DBUS 세션을 찾지 못해 발생하는 경고 내용입니다. 해결 책은 간단합니다. 출력 메시내용을 콘솔창에서 수행 하면 됩니다.